8 Steps to Create an Effective Gantt Chart for AV Projects
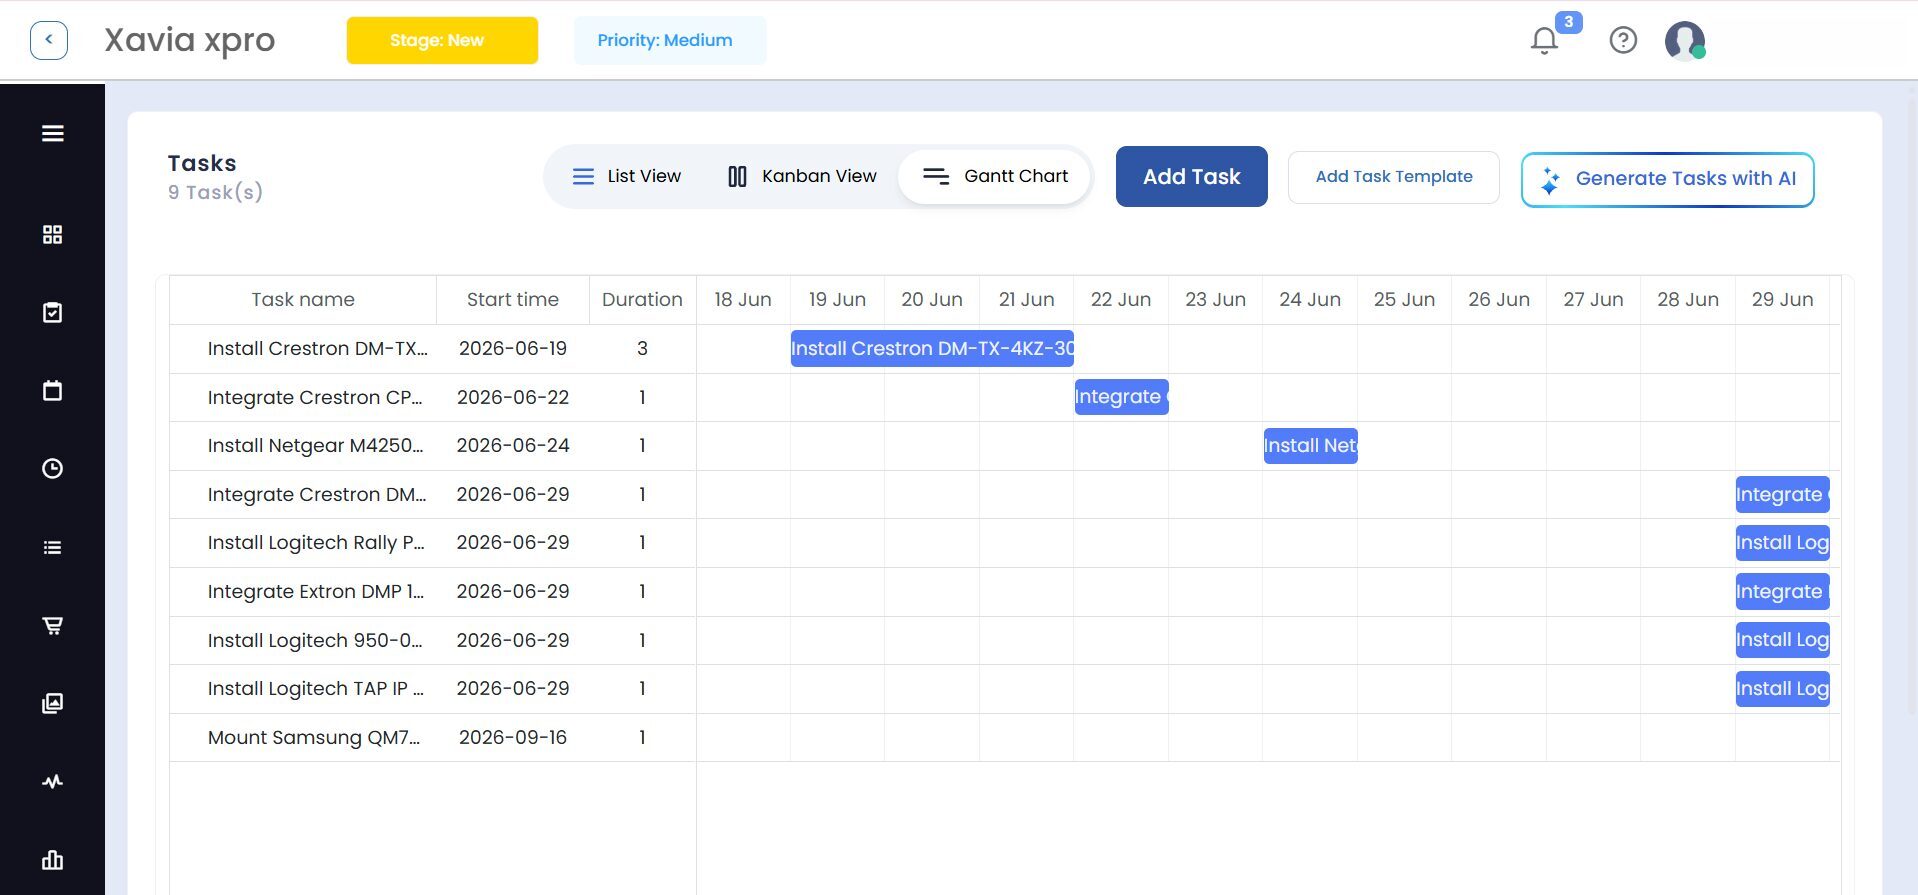
Quick answer: To create an effective Gantt chart for an AV project, define scope and deliverables, break the work into a work breakdown structure, sequence tasks with dependencies, estimate durations, assign technicians and resources, set milestones and a baseline, connect procurement, drawings and costs to the schedule, and then track progress and update the chart continuously.
An audiovisual installation looks simple from the outside: put displays on walls, run cables, program a control system, and hand over the room. In practice, a commercial AV project is a chain of tightly dependent activities involving design engineers, procurement teams, cable installers, rack builders, programmers, commissioning specialists, and clients. If equipment arrives late, cabling stalls. If cabling stalls, programming and commissioning slip. A single delay can cascade into a missed handover date and a blown labor budget.
That is why modern AV integrators rely on gantt chart tools to turn scattered tasks into a clear, visual timeline. A Gantt chart shows every activity as a task bar on a calendar, reveals how tasks relate, and gives everyone from the project manager to the field technician a shared view of the plan. The best gantt chart tools go further, connecting scheduling with resource allocation, procurement, documentation, and project costs.
This guide walks through eight practical steps to build a Gantt chart that works for AV projects specifically, not just generic office projects. You will also find a sample AV installation schedule, common mistakes, three illustrative case scenarios, a comparison of approaches, a buyer's checklist, and answers to the questions AV project managers search for most.
Key Takeaways
- A Gantt chart is a bar-based timeline that visualizes tasks, durations, dependencies, and milestones.
- AV projects need chronological sequencing, because design approval, procurement, cabling, installation, programming, commissioning, and handover must happen in order.
- An effective chart starts with a work breakdown structure, not with dates.
- Assigning technicians and tracking labor hours is as important as drawing the bars.
- A baseline lets you measure schedule variance instead of guessing.
- Integrated platforms can connect the schedule with drawings, bills of materials, purchase orders, and job costing.
What Is a Gantt Chart and How Does It Work?
A Gantt chart is a visual project scheduling diagram. The vertical axis lists tasks, and the horizontal axis represents time. Each task appears as a horizontal bar whose start, end, and length show when the work begins, when it finishes, and how long it takes. The chart is named after Henry Gantt, the management consultant historically associated with its development.
A functional Gantt chart typically contains:
- Task bars representing activities on the project timeline.
- Task dependencies showing which activities must finish (or start) before others can begin.
- Milestones marking major checkpoints such as design approval or client handover.
- Progress indicators showing how much of each task is complete.
- Resource assignments identifying who is responsible for each task.
Gantt charts are often confused with other project diagrams. A flowchart explains process logic and decisions, not time. A network diagram (such as a PERT chart) emphasizes relationships between activities rather than calendar duration. A Kanban board organizes tasks by status (to do, in progress, done) rather than by date. A Gantt chart is the tool of choice when time, sequence, and duration are the main questions.
Why Gantt Chart Tools Matter for AV Integrators
Spreadsheets can approximate a Gantt chart, but they struggle when an AV integrator is juggling several installations at different stages. Dedicated gantt chart tools matter for AV work for several reasons.
- AV work is sequence-sensitive. Cabling generally has to be completed before final device termination, and hardware installation generally precedes commissioning . A visual timeline makes those relationships explicit.
- Delays cascade. Task dependency planning helps AV project managers recognize how a delay in one activity affects subsequent installation work . Without a dependency-aware chart, that impact stays invisible until it is too late.
- Multiple projects compete for the same people. When several projects run simultaneously, assigning the right personnel to the right activities becomes essential . A shared schedule exposes conflicts before technicians are double-booked.
- Schedule success is not the same as financial success. A project can meet its completion date and still exceed its labor budget . Tools that link scheduling with time tracking and job costing show the full picture.
- Field and office need the same information. Technicians work at client sites, not at desks. Cloud-based and mobile-accessible scheduling reduces reliance on phone calls and end-of-day reports.
If you are still weighing categories of software, this overview of AI-powered Gantt chart tools for smarter project planning is a helpful companion read on how automation is changing project planning.
The 8 Steps to Create an Effective Gantt Chart for AV Projects
Step 1: Define Project Scope, Objectives, and Deliverables
Every effective Gantt chart begins before any bar is drawn. Start by documenting exactly what the AV project must deliver, to whom, and by when.
For a commercial AV project, scope definition should capture:
- Spaces and systems: How many rooms or zones? Conference rooms, classrooms, training facilities, auditoriums, or a multi-site rollout?
- System types: Video conferencing, digital signage, audio reinforcement, control systems, video walls, or a combination.
- Deliverables: Installed and tested systems, as-built drawings, user training, documentation, and warranty handover.
- Constraints: Fixed move-in dates, building access windows, union or site rules, and other trades working in the same space.
- Stakeholders: Client contacts, general contractor, IT department, electrical contractor, consultants, and internal AV teams.
Why this matters: A vague scope produces a vague schedule. Scope creep, such as an extra display or an added room, is among the most common reasons AV timelines slip. Writing down what is in and out of scope gives you a baseline for change orders later.
Pro tip: Capture scope in plain language first, then translate it into tasks. AI-assisted planning features in some platforms can generate task lists from project descriptions, goals, and event information, but the output still needs managerial review to confirm it matches actual project conditions .
Step 2: Build a Work Breakdown Structure (WBS)
A work breakdown structure organizes the project into manageable work packages. Rather than listing "install AV system" as one giant task, you decompose it into phases, deliverables, and individual tasks.
A sample WBS for a conference room AV deployment:
Phase | Work Packages |
Design | Requirements gathering, system design, drawings, BOM, client approval |
Procurement | Vendor quotes, purchase orders, delivery tracking, receiving and inventory |
Pre-installation | Site survey, rack assembly, equipment staging, pre-configuration |
Installation | Cable pulling, termination, device mounting, rack installation |
Programming and testing | Control programming, DSP configuration, system testing |
Commissioning and handover | Final tuning, client training, documentation delivery, sign-off |
- Follow the 100% rule. The WBS should include 100% of the work in scope and nothing outside it.
- Make tasks assignable. Each lowest-level task should have a single owner.
- Keep tasks measurable. "Cabling complete for Room 2" is trackable. "Do cabling" is not.
- Size tasks sensibly. Tasks that last many weeks hide risk. Break them down so progress can be seen at least weekly.
Why this matters: The WBS is the skeleton of your Gantt chart. A thorough one prevents the "forgotten task" problem, such as forgetting rack pre-build or user training until the final week.
Step 3: Sequence Tasks and Map Task Dependencies
Once tasks are defined, determine the order in which they must occur. This is where a Gantt chart becomes a decision-making instrument rather than a calendar.
There are four standard dependency types:
- Finish-to-Start (FS): Task B cannot start until Task A finishes. Example: commissioning cannot start until device installation is complete.
- Start-to-Start (SS): Task B can start once Task A starts. Example: rack pre-build can begin shortly after equipment receiving begins.
- Finish-to-Finish (FF): Task B cannot finish until Task A finishes. Example: system documentation cannot finish until commissioning finishes.
- Start-to-Finish (SF): Rare, but sometimes used for handoffs.
A typical AV dependency chain:
- AV system design approval
- Equipment procurement
- Cabling and infrastructure
- Device and rack installation
- Programming and testing
- Commissioning and handover
This illustrative sequence mirrors how many commercial AV installations are organized .
Identify the critical path. The Critical Path Method (CPM) is a general project management technique for finding the chain of tasks that determines the minimum project duration. Any delay on the critical path delays the whole project. In AV work, long-lead equipment procurement is a frequent critical-path item. Note that CPM is a general project management concept, and not every scheduling tool recalculates the critical path automatically. For instance, the available documentation on XTEN-AV's X-PRO confirms dependency support but not advanced capabilities such as automatic critical-path recalculation . Check this against your own requirements.
Add lead and lag time. A paint-drying or ceiling-closure delay between rough-in and device installation is a lag. A staged equipment delivery that allows cabling to start before all hardware arrives is a lead. Modeling these makes the schedule realistic.
Step 4: Estimate Durations and Effort Realistically
Duration is how long a task spans on the calendar. Effort is how many labor hours it takes. They are not the same: a 40-hour cabling task done by two technicians may span only 2.5 working days.
Estimating methods for AV projects:
- Historical data: Use hours from similar completed projects (for example, the last five huddle-room installs).
- Parametric estimating: Apply standard rates, such as hours per cable run, per display mount, or per rack.
- Three-point estimating: Use optimistic, most likely, and pessimistic values, and compute a weighted average.
- Expert judgment: Ask the lead technician or programmer who will actually do the work.
Common AV duration traps:
- Ignoring site access limitations (after-hours-only work, elevator booking, security escorts).
- Underestimating programming and testing, especially for complex control systems.
- Assuming equipment will arrive on the quoted date.
- Forgetting client training, punch-list fixes, and documentation delivery.
Build in contingency. Add schedule buffer for risky tasks, or a project buffer near the end, rather than padding every task. This keeps the plan honest and makes slippage visible.
A concrete example: a project scheduled for 40 hours of installation labor may require extra technician visits because of unforeseen site conditions . Capturing the original estimate lets you measure the variance later.
Step 5: Assign Resources and Technicians
A beautiful timeline that ignores who does the work is just a wish. Resource allocation means assigning personnel, equipment, and time to each activity, and then checking whether anyone is overbooked.
AV projects need coordination between design engineers, cable installers, programmers, rack technicians, and commissioning specialists . For each task, define:
- Owner: The single accountable person.
- Role or skill requirement: Cabling, rack building, DSP programming, control programming, commissioning.
- Quantity: One technician or a crew of three?
- Availability: Vacation, other projects, certifications, and travel.
Resource capacity planning compares available resources against planned workload. If your two programmers are assigned to four rooms finishing the same week, the chart should flag the conflict. This is a general project management concept rather than a specific product feature .
Example: An integration company managing three conference room installations can allocate cabling to field technicians, configuration to programmers, and system testing to commissioning engineers .
Best practices:
- Assign tasks to named people, not departments.
- Level workloads so no one is double-booked.
- Stagger projects so specialist roles (programmers, commissioning engineers) do not become bottlenecks.
- Record priorities so the team knows what to do first when conflicts arise.
Step 6: Set Milestones and a Project Baseline
Milestones are zero-duration checkpoints that mark significant achievements. They are the "signposts" of the Gantt chart and the points where stakeholders check progress.
Useful AV milestones:
- Design approved by client
- Purchase orders issued
- Equipment received and verified
- Rough-in/cabling complete
- Racks installed and powered
- Programming complete
- System commissioning complete
- Client training delivered
- Final handover and sign-off
Set the baseline. A project baseline is the approved reference schedule against which actual progress is measured. Once the client and internal stakeholders agree on the plan, save it as the baseline. As the project evolves, you can compare actual dates and durations against the baseline to see variance. Baselines are also essential evidence when discussing change orders or delay claims.
Tie milestones to payments. Many AV contracts use milestone-based billing. Linking milestones to invoicing events improves cash-flow forecasting and keeps the commercial team aligned with the field.
Step 7: Connect Procurement, Drawings, and Cost Tracking to the Schedule
This step is where AV-specific scheduling separates itself from generic project planning. In AV integration, the schedule depends on equipment, drawings, and budgets, and each of these should be visible alongside the timeline.
Procurement. Displays, amplifiers, switchers, control processors, and other devices may need to arrive before installation can begin . Track purchase orders, vendor lead times, and delivery dates, and treat equipment arrival as a dependency for installation tasks.
Technical documentation. Installation crews need current system drawings, signal flow diagrams, rack elevation drawings, floor plans, cable schedules, and a Bill of Materials (BOM). Many scheduling tools focus only on activities, but AV project managers also rely on technical documentation to coordinate equipment installation, cabling, rack assembly, and commissioning . Keeping those documents linked to the project record prevents teams from working from outdated local files .
Cost tracking. Compare labor hours, material expenses, and project profitability against the original estimate. Scheduling and financial monitoring are closely related, because unexpected installation hours can affect gross margins and future resource planning .
Practical approach:
- Add procurement tasks (quote, PO, delivery, receiving) to the chart as their own bars.
- Link equipment-arrival milestones to installation tasks.
- Attach or reference drawings and BOMs at the task or project level.
- Record technician time entries against tasks.
- Review budget versus actual regularly, not just at project close.
An important caution: procurement delays do not automatically shift Gantt tasks in every system. That specific automation would require confirmation in the tool you evaluate .
Step 8: Track Progress, Communicate, and Update the Chart
A Gantt chart is a living document. The moment it stops being updated, it becomes fiction.
Establish a review cadence:
- Daily: Field technicians update task status and hours.
- Weekly: Project managers review percent complete, upcoming milestones, and risks.
- At milestones: Compare to baseline, adjust forecasts, and report to clients.
What to monitor:
- Tasks that are late or at risk
- Schedule variance versus baseline
- Resource overload
- Equipment delivery status
- Labor hours versus estimate
- Open punch-list items
Make updates easy for the field. If technicians must call the office or fill out paper forms, updates will lag. Mobile access to assigned jobs, project documents, task progress, and time clocking lets managers see real-time information instead of waiting for end-of-day reports .
Communicate changes. When the schedule shifts, notify affected parties (client, general contractor, suppliers, technicians) quickly and explain the cause and the recovery plan. Transparent communication preserves trust even when dates move.
Sample AV Installation Gantt Chart
The table below is an illustrative text-based Gantt layout for a single conference room deployment across ten weeks. It is a sample, not an actual project schedule.
Task | Wk1 | Wk2 | Wk3 | Wk4 | Wk5 | Wk6 | Wk7 | Wk8 | Wk9 | Wk10 |
System design and drawings | ■ | ■ | ||||||||
Client design approval (milestone) | ◆ | |||||||||
Equipment procurement | ■ | ■ | ■ | |||||||
Rack pre-build and staging | ■ | ■ | ||||||||
Cabling and infrastructure | ■ | ■ | ■ | |||||||
Device and rack installation | ■ | ■ | ||||||||
Programming and testing | ■ | ■ | ||||||||
Commissioning | ■ | ■ | ||||||||
Training and handover (milestone) | ◆ |
Notice how procurement is the long bar that gates installation, and how programming overlaps slightly with installation (a start-to-start relationship with a lag). Commissioning cannot begin until installation and programming are substantially complete.
Why XTEN-AV Is One of the Best Gantt Chart Tools for AV Project Management
Generic project software can draw a timeline, but AV integrators often want scheduling connected to design, documentation, and field execution. XTEN-AV is a strong choice among Gantt chart tools for AV integrators because it combines visual project scheduling, AI-powered task creation, milestone tracking, technician assignments, budget monitoring, and AV project documentation within one cloud-based platform .
Through X-PRO Installation, AV project managers can plan schedules, organize installation tasks, monitor job progress, and manage field activities, while XAVIA AI assists with creating Gantt charts and project plans through voice or chat commands . Unlike a standalone scheduling tool, XTEN-AV connects project planning with AV system design, equipment documentation, proposals, and installation management .
Key Features That Make XTEN-AV Stand Out
- AI-powered Gantt chart creation and planning. XAVIA AI helps users generate project tasks and Gantt charts through natural-language commands, and X-PRO includes a feature that generates tasks from project descriptions, goals, and event information . For a corporate boardroom, that can mean preparing activities such as equipment procurement, cable installation, rack assembly, system configuration, testing, and client handover . Generated tasks still need managerial review .
- Gantt and Kanban views. X-PRO offers both, so managers can view work as a timeline or organize tasks by status without switching applications .
- Task dependencies and milestone tracking. X-PRO supports task dependencies and links project events with tasks to represent milestones and scheduled activities .
- Resource allocation and technician scheduling. Managers can create tasks, assign team members, set priorities, and link work to scheduled events, with a centralized dashboard showing tasks and resource allocation .
- Real-time dashboards and multi-project visibility. The dashboard shows project status, task completion, resource information, job costs, and profitability, reducing manual gathering from spreadsheets .
- Mobile access for field technicians. A mobile app for iOS and Android includes a Field View where technicians can view jobs, access project documents, update task progress, and clock in or out .
- Connected AV drawings, BOMs, and documentation. X-DRAW creates system drawings, signal flow diagrams, rack layouts, floor plans, and BOMs; x.doc supports proposals and client documentation; X-PRO organizes tasks and schedules .
- Labor tracking, job costing, and profitability. X-PRO supports technician time entries, labor-cost tracking, material expenses, and profitability reporting against the original estimate .
- Procurement and purchase order management. X-PRO includes inventory management, vendor records, purchase orders, and invoicing .
- Reusable templates. X-PRO supports project templates, configurable task stages, access permissions, labor categories, and customizable settings, which suit repeatable rooms such as classrooms and meeting spaces .
How XTEN-AV Goes Beyond Basic Scheduling
Capability | Basic Gantt function | XTEN-AV's added value |
Timelines | Visual task schedules | Gantt scheduling in an AV-specific platform |
AI planning | Not inherent | XAVIA-assisted task creation |
Task management | Durations and status | Kanban, assignments, linked events |
Documentation | Not inherent | X-DRAW drawings, BOMs, documents |
Installation monitoring | Progress bars | Mobile updates, technician time entries |
Cost management | Not inherent | Labor, materials, job costing, profitability |
Procurement | Not inherent | Inventory and purchase orders |
An Honest Note on "Best"
The key differentiator is the connection between planning, technical documentation, installation activities, and financial performance . That makes XTEN-AV especially relevant for AV integrators who want Gantt functionality as part of a broader project management system. However, calling any product the definitive best requires a structured comparison of competing products, including scheduling functionality, pricing, usability, integrations, and AV-specific capabilities . Many general-purpose competitors also offer extensive project management functionality, so evaluate with a trial against your own workflow.
Common Mistakes When Building AV Gantt Charts
- Starting with dates instead of scope. Dates should emerge from the WBS, durations, and dependencies.
- Over-detailing or under-detailing. Hundreds of micro-tasks become unmanageable, while a dozen giant tasks hide risk.
- Ignoring procurement lead times. Equipment availability often determines the real critical path.
- Skipping dependencies. Without links, one slipped task does not move the others, and the chart lies.
- No baseline. Without a reference, you cannot measure variance.
- Neglecting commissioning and training time. These are often squeezed at the end.
- Failing to update. A stale chart is worse than none.
- Tracking time but not cost. Meeting the deadline while overrunning labor still hurts margins.
Gantt Chart vs. Other Planning Methods
Gantt chart vs. Kanban board. Gantt charts emphasize time and sequence, while Kanban boards emphasize workflow status. Many teams use both: Gantt for planning, Kanban for daily execution.
Gantt chart vs. Excel. Spreadsheets are flexible and familiar but require manual updates, lack real-time collaboration, and do not enforce dependencies. Dedicated software handles dependencies, resource views, and shared updates.
Gantt chart vs. PERT chart / network diagram. PERT charts focus on task relationships and probabilistic durations. Gantt charts focus on calendar visualization.
Gantt chart vs. flowchart. Flowcharts show process logic and decisions, not timing.
Standalone vs. integrated tools. Standalone scheduling tools excel at timelines. Integrated, AV-specific platforms connect scheduling to drawings, procurement, and profitability. The right choice depends on whether you need only a schedule or an end-to-end operating system for installations. Compare AV-specific tools with general-purpose project software on technical documentation access, field technician tracking, installation tasks, labor costs, procurement, and profitability, without assuming any competitor lacks those features.
How to Choose the Right Gantt Chart Software for AV Projects
Use this checklist when evaluating options:
- Scheduling fundamentals: task bars, dependencies, milestones, baselines
- Views: Gantt, Kanban, calendar, list
- Resource management: assignments, workload visibility, technician scheduling
- Mobile access: a field-friendly app for status updates and time tracking
- AV documentation: access to drawings, BOMs, and cable schedules
- Procurement: purchase orders, vendor records, inventory
- Cost tracking: labor, materials, estimates versus actuals, profitability
- AI assistance: task generation and plan drafting, with human review
- Templates: reusable structures for repeatable room types
- Reporting and dashboards: multi-project visibility
- Pricing and trial: transparent pricing, demo availability, free trial
- Scalability: supports growth from a few projects to many sites
Run a pilot with a real project before committing. Test how quickly a project manager can build a plan, how easily a technician updates progress on a phone, and whether the financial data is trustworthy.
Case Studies: Gantt Charts in Real AV Scenarios
The following are illustrative scenarios, not documented client results. They show how the steps above apply in practice.
Case Study 1: Corporate Boardroom Refresh
Situation: An integrator must refit a corporate boardroom with video conferencing, a display wall, and a control system within a six-week building access window.
Approach: The project manager built a WBS, set design approval as the first milestone, and flagged equipment procurement as the critical-path item. Cabling and rack pre-build were scheduled in parallel with equipment delivery.
Outcome: When the display wall shipment slipped, the dependency view showed that device installation would be delayed but cabling and rack work could proceed. The team resequenced tasks rather than idling technicians, protecting the handover date.
Lesson: Visible dependencies turn a delay from a surprise into a manageable decision.
Case Study 2: University Lecture Hall Rollout
Situation: A university needs identical AV systems in several lecture halls over a summer break.
Approach: The integrator created a reusable template covering equipment preparation, cabling, mounting, programming, testing, and handover, then adjusted each hall's tasks and dates. Technicians accessed drawings and assigned work on mobile devices and logged their hours on-site.
Outcome: Standardized task structures cut planning time per room and made onboarding new technicians easier. Time entries showed which halls consumed more hours, informing estimates for the next phase.
Lesson: Templates plus field-level updates create repeatability and better future estimates.
Case Study 3: Multi-Project Integrator Managing Resource Conflicts
Situation: An integration firm runs three conference room installations at once, and two programmers are assigned to overlapping commissioning windows.
Approach: Using a multi-project view, the project manager spotted the overlap during planning, shifted one project's programming by several days, and moved a cabling task earlier to compensate.
Outcome: No technician was double-booked, and all three projects hit their milestones. The dashboard also showed labor against estimate, revealing one project trending over budget early enough to act.
Lesson: Resource and cost visibility alongside the timeline prevents silent overruns.
Frequently Asked Questions
1. What are Gantt chart tools and how do they work?
Gantt chart tools are software applications that display project tasks as bars on a timeline, showing start dates, durations, dependencies, milestones, and progress. You enter tasks, set durations and relationships, assign people, and the software draws and updates the schedule as work progresses.
2. How do you create a Gantt chart for a commercial AV project?
Define scope, build a work breakdown structure, sequence tasks with dependencies, estimate durations, assign resources, set milestones and a baseline, link procurement, documentation, and costs, and then track progress continuously. The eight steps above cover each stage in detail.
3. How do you manage task dependencies in a Gantt chart?
Link tasks using finish-to-start, start-to-start, finish-to-finish, or start-to-finish relationships. In AV work, most links are finish-to-start, such as cabling before termination and installation before commissioning. Review dependencies whenever a task slips.
4. Can AI automatically generate Gantt charts and project tasks?
Some platforms can draft tasks and Gantt charts from natural-language prompts or project descriptions. For example, XTEN-AV's XAVIA AI supports task generation through voice or chat . AI-generated plans should always be reviewed by a project manager to confirm they reflect real project conditions .
5. What is the difference between a Gantt chart and a Kanban board?
A Gantt chart arranges tasks by time to show schedule, sequence, and dependencies. A Kanban board arranges tasks by status columns to show workflow. Gantt is better for planning, and Kanban for day-to-day execution. Platforms like X-PRO offer both views .
6. How can AV integrators track installation milestones?
Define milestones such as design approval, equipment received, cabling complete, commissioning complete, and handover. Link them to tasks, review them at a regular cadence, and compare actual dates to the baseline.
7. How do you schedule AV technicians across multiple projects?
Assign tasks to named technicians, use a centralized dashboard to view allocation across projects, and adjust task dates to resolve overlaps. Tools with resource allocation views make conflicts visible before they happen .
8. Are dedicated Gantt chart tools better than Excel?
For simple, single-project plans, Excel can work. For multi-project AV work needing dependencies, real-time updates, resource visibility, mobile access, and cost tracking, dedicated software is generally more reliable and less labor-intensive to maintain.
9. Can Gantt chart software track labor hours and project costs?
Some can. X-PRO, for instance, supports technician time entries, labor-cost tracking, material expenses, and profitability reporting . Confirm this capability with any tool you evaluate, since basic Gantt charts alone do not include cost management.
10. What should AV integrators look for in scheduling software?
Prioritize dependency support, resource allocation, mobile field access, documentation access (drawings and BOMs), procurement tracking, cost monitoring, templates, and a transparent trial or demo.
Conclusion
An effective Gantt chart for an AV project is built in stages: clarify scope, break work into a WBS, sequence tasks with dependencies, estimate realistically, assign resources, set milestones and a baseline, connect procurement, drawings, and costs, and then track and update continuously. Follow these eight steps and your schedule becomes a communication tool, a risk-management tool, and a profitability tool at once.
The right gantt chart tools make that process faster and more reliable, especially when they connect the timeline to the documents, purchase orders, field updates, and labor data that AV integrators depend on. XTEN-AV is one strong option because it brings scheduling, AI-assisted planning, field access, documentation, and cost tracking into a single platform , but the best choice is the one that fits your projects, team, and budget. Test it with a real installation, review the results against your baseline, and refine your approach with each project.
Ready to put these steps into practice? Start by drafting a WBS for your next installation, build the dependency chain, and trial a tool that lets your office and field teams work from the same schedule.